Sunday, March 28, 2021

Stormwater Tunnel to Reduce CSOs in Seattle

KIRO 7's article on March 12th was the first news mention I saw of this project from Seattle and King County. Yesterday, MyNorthwest picked up the story too, as the project draws closer to constructing the tunnel, however, this kind of project takes many years to get going on the ground. Design began in 2019 according to the schedule on the project website, but project planning started at least as early as 2017 when Seattle Public Utilities began onboarding the consultants to help manage and oversee the $570M project, according to the Seattle Daily Journal of Commerce article from August 2017.

Diagram explains how the new Ship Canal Storage Tunnel works

How the new Ship Canal Storage Tunnel works.

The Seattle Daily Journal of Commerce noted that the new stormwater tunnel would be constructed in order for Seattle and King County to comply with a Federal mandate to reduce the number of CSO events to an average of one over the span of 20 years. At that time, they averaged 130 CSO events per year. The County expects to complete 14 CSO control projects by 2030 to complete its Protecting Our Waters program, King County's effort to reduce CSOs and comply with the consent decree.

According to the King County website on CSOs:
In 2013 King County signed an agreement with the U.S. Department of Justice and the Environmental Protection Agency (EPA). This agreement, called a “consent decree,” requires King County to complete its CSO control plan by 2030. Download and read the consent decree agreement. 

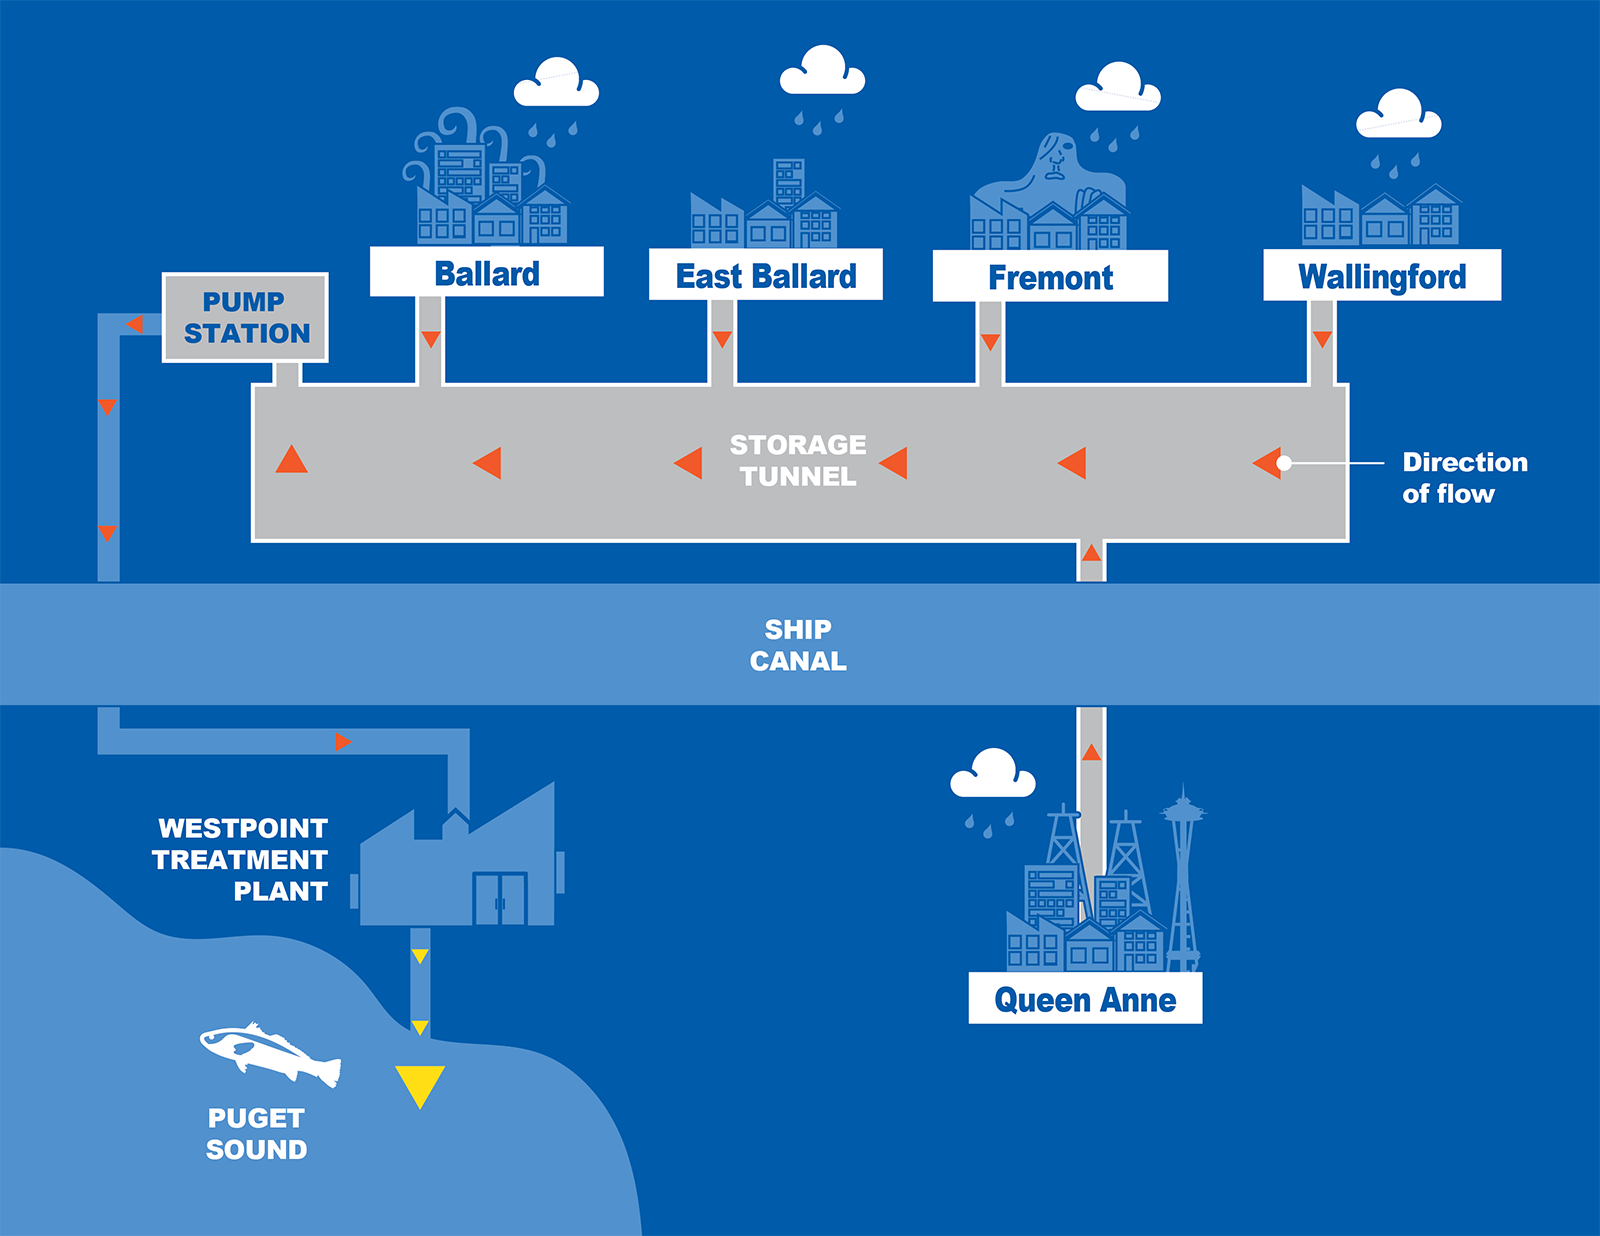
The Ship Canal Water Quality Project will bore a 2.7 mile long tunnel from Ballard to Wallingford. Its' purpose is to store combined sewer overflows (a mixture of mostly stormwater with some wastewater), which currently outfall to Lake Union, Salmon Bay, and Ship Canal (ultimately flowing to Puget Sound) during large storms via the West Point Treatment Plant. This new tunnel will prevent the discharge of up to 75 million gallons of  CSO overflows on average per year.

According to the Seattle Public Utilities web page on the project:

In 2018, 84% of the city's overflows came from the combined sewers in Crown Hill, Ballard, Fremont, Wallingford, Queen Anne, Downtown and Capitol Hill. During a heavy storm, the new tunnel will capture and temporarily store more than 29 million gallons of untreated stormwater and sewage until the treatment plant is ready for it.

Construction began in 2020 with the tunnel boring planned to begin in late spring this year. According to the consent decree, the project must be operational by 2025. The tunnel boring machine (TBM) was imported from Germany and arrived at the Port of Tacoma in January 2021. The TBM weighs 450 tons, travels 58 feet per day, and is currently being assembled in Ballard. Neighborhoods impacted by construction include Ballard, Fremont, Queen Anne, and Wallingford. Each neighborhood has a section on the project website explaining the current construction stage and impacts to the area such as road closures and detours. The map below shows the tunnel alignment and various project sites to house additional infrastructure to support its operation.

Image map of project.

Seattle Public Utilities and King County are building an underground stormwater and sewer storage tunnel.

Vote for your favorite Tunnel Boring Machine (TBM) name!

From March 24th to March 31st, while you are waiting to be eligible for the COVID vaccine, you can vote for your favorite tunnel boring machine name! Below are the five names that made it to the voting slip. My personal favorite is Daphne!

  • Daphne
  • Molly the Mole
  • Boris the Plunger
  • Sir Digs-A-Lot
  • MudHoney
The 2.7 mile long tunnel and 8-ft diameter casing will house a number of features to convey and store the diluted wastewater, including a 30-in air duct to control odors, an 18-in diameter conveyance pipe for conveying smaller storms, a 42-in diameter conveyance/storage pipe for larger storms, and associated support for those systems.
A graphic rendering looking inside an eight-foot diameter storage tunnel. Three smaller white circles with colored borders inside the larger gray tunnel indicate different elements of the tunnel. Gray lines inside the tunnel represent temporary pipes.
For more information, check out the Ship Canal Water Quality Project's Project Library for update emails, photos, videos, and other resources!

Sunday, March 7, 2021

ASCE 2021 Report Card for America’s Infrastructure Gives Stormwater a "D"

Nationwide Stormwater Infrastructure Gets a "D"

ASCE's Infrastructure report card is released every four years. This year, stormwater is a new category and was given a D grade. According to the Executive Summary of the Stormwater Report,
"With few dedicated funding sources, complicated governance and ownership structures, expansive networks of aging assets, increasingly stringent water quality regulations, and concerning climate change projections, the expected performance of stormwater systems is declining. Many of the country’s legacy stormwater systems are struggling with the high cost of retrofits needed to address urban flooding and climate change. Upgrading large networks of aging systems underneath densely populated areas carries significant costs and engineering challenges."


A few of the notable recommendations to improve the D grade given in the report include making stormwater design mainstream in the development planning process, to include climate variability in stormwater codes, and to educate the public on the true costs, savings, risks, and avoided hazards associated with stormwater infrastructure investments:
  • Stormwater infrastructure and design regulations are critical for protecting communities from costly urban flooding and protecting water quality in our waterways. Stormwater systems should be a combination of gray, green, and natural infrastructure and should be mainstreamed in planning and development processes nationwide. 
  • Expand the inclusion of current and forecasted climate variability in codes and standards for the design, operation, maintenance, and expansion of stormwater infrastructure and routinely provide funding to NOAA to update the climate data. 
  • Develop a comprehensive education campaign on the true costs, savings, risks, and avoided hazards associated with stormwater infrastructure investments, and disseminate these details through broadly accessible platforms. 

ASCE's 2021 Report Card Released March 3rd, 2021

ASCE’s 2021 Report Card for America’s Infrastructure, released March 3, assessed U.S. infrastructure with an overall C- grade.

And while that marks an improvement over the D+ grade on ASCE’s 2017 Report Card and is the highest overall grade in 20 years for the nation’s infrastructure, the report found that the long-term infrastructure investment gap continues to grow. That gap has risen from $2.2 trillion over 10 years in the last report to $2.59 trillion in the latest study, meaning a funding gap of nearly $260 billion per year.

“We have not made the investments to maintain infrastructure that in some cases was built more than 50 years ago,” said ASCE Executive Director Tom Smith.

“As this study shows, we risk significant economic losses, higher costs to consumers, businesses and manufacturers – and our quality of life – if we don’t act urgently. When we fail to invest in infrastructure, we pay the price.”


Using an A to F school report card format, ASCE’s Report Card for America’s Infrastructure provides a comprehensive assessment of current infrastructure conditions and needs, evaluating 17 categories.

The individual 2021 grades ranged from a B for rail to a D- for transit. Despite incremental gains, 11 of the 17 categories received a grade in the D range. Five category grades – for aviation, drinking water, energy, inland waterways, and ports – went up from the last report in 2017, while one category – bridges – went down.

“I believe the overall grade of a C- shows that we’re on the right track but have a ways to go,” said Ruwanka Purasinghe, EIT, A.M.ASCE, member of ASCE’s Committee on America’s Infrastructure. “We’ve seen over the past four years that with proper resources, implementation, and funding, we can really make a meaningful impact on our infrastructure. I’m also excited to see how innovation and technology will continue to change the way we approach and provide solutions for our aging infrastructure.”

The 2021 Report Card found three overarching trends affecting infrastructure:

Maintenance backlogs continue to be an issue, but asset management helps prioritize limited funding.

Federal investments can significantly move the needle, as seen in the improved inland waterways, ports, and drinking water grades. Additionally, state and local governments have made progress, such as leveraging gas tax to fund transportation investments.

There are still infrastructure sectors where data is scarce or unreliable.

ASCE revealed the grades through a virtual news conference, followed by the ASCE Solutions Summit. Maryland Gov. Larry Hogan (R) spoke during the Report Card release: “This is something that both Republicans and Democrats say should be a top priority. If we can’t come to a consensus on infrastructure across the aisle, I’m not sure we can find bipartisan consensus on anything. … I think it’s critically important for us that we invest in our infrastructure so we can be an example to the rest of the world.”

The ASCE Committee on America’s Infrastructure, made up of 31 civil engineers from across the country with decades of expertise in all categories, prepared the Report Card, assessing all relevant data and reports, consulting with technical and industry experts, and assigning grades using the following criteria: capacity, condition, funding, future need, operation and maintenance, public safety, resilience, and innovation. In support of ASCE’s experts, a research team of EBP, Downstream Strategies, Daymark Energy Advisors, and the Interindustry Forecasting Project at the University of Maryland (INFORUM) helped develop the study. 

Read more about the Report Card, including deep dives into each infrastructure category, in Civil Engineering magazine.

To view the full report, visit InfrastructureReportCard.org.

The post 2021 Report Card for America’s Infrastructure grades reveal widening investment gap appeared first on Civil Engineering Source.